Using speed distributions
You can for instance use speed distributions for the following use cases:
- The speed distribution for the Lane change speed difference attribute in the driving behavior determines the speed at which a vehicle wants to change lanes (Editing the driving behavior parameter Lane change behavior).
- The speed distribution function of desired speeds (desired speed distributions) is a particularly important parameter, as it has an impact on link capacity and achievable travel times. If not hindered by other vehicles or network objects, e.g. signal controllers, a driver will travel at his desired speed. This applies accordingly to pedestrians. You may use desired speed distributions for vehicle compositions, pedestrian compositions, reduced speed zones, desired speed decisions, PT lines and parking lots.
A driver, whose desired speed is higher than his current speed, will check whether he can overtake other vehicles without endangering anyone. The more drivers' desired speed differs, the more platoons are created.
Example:
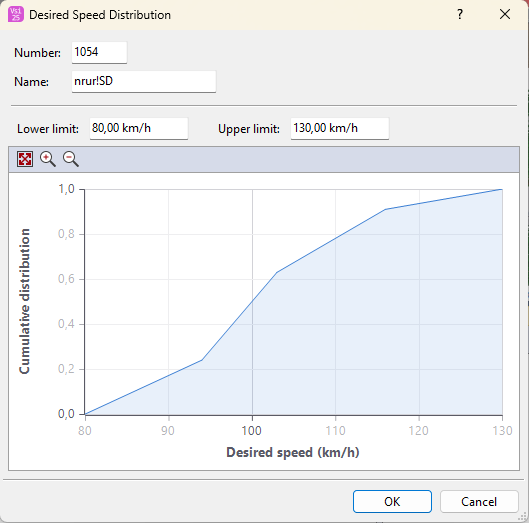
The figure shows an example in which 22 % of the vehicles drive between 80.0 and 94.50 km/h and 78% of the vehicles between 94.50 km/h and 130.00 km/h (all equally distributed across the speed range). Due to the S-shaped distribution of the three intermediate points at 94.50 km/h, approx. 104 km/h and 116 km/h, a concentration around the mean value 105 km/h is achieved.
For pedestrian simulation with Viswalk you can use desired speed distributions described in the specialized literature (Using desired speed distributions for pedestrians).
|
|
Note: Speed distributions for typical speeds of different vehicles and pedestrians are predefined in Vissim. |

Superordinate topic:
Information on editing:
Defining the empirical distribution
Defining a normal distribution
Editing the graph of a function or distribution
Deleting intermediate point of a graph
Using emission class distributions
Attributes of free distributions
Defining 2D/3D model distributions for 2D/3D models
Attributes of 2D/3D model distributions
Related topics:
