Equilibrium assignment – Example
The example explains the redistribution of relative target volumes in equilibrium assignment based on a single OD pair with only four paths.
Target volumes on the basis of previous simulation runs
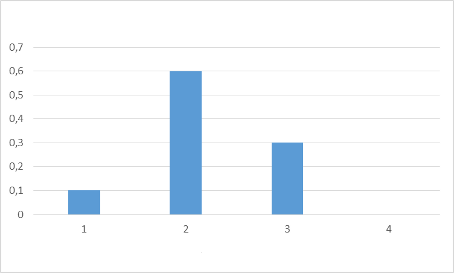
The illustration below shows the relative target volumes on the basis of previous simulation runs with equilibrium assignment. Most volumes were distributed to path 2 in the last simulation run completed, followed by path 3 and path 1. Path 4 had no volumes in the previous simulation run.
Relative target volume of previous simulation runs path 1 to 4:
 : Relative target volume before
Cost measured in previous simulation run
The illustration below shows the cost measured in the previous simulation run. Path 3 was by far the most expensive path and also the only path that was more expensive than the average cost. Path 2 was closest to the average cost. Path 4 was slightly less expensive and path 1 was the least expensive.
Cost of path 1 to 4:
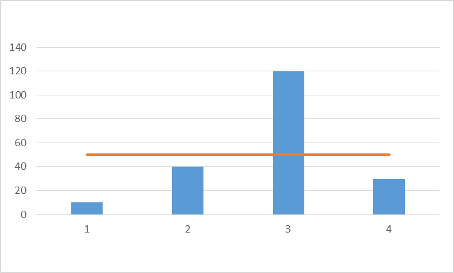
Cost
 Average cost
Redistribution of the volume
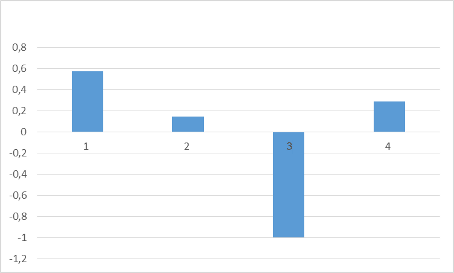
The volume can be redistributed by means of this data (Method of path selection with or without path search). From the calculation of the formulas it follows that a share of the total volume, which shall be redistributed, is distributed to the individual paths. This is shown by the illustration below. The entire share of the total volume, which shall be redistributed, is taken from path 3 because path 3 was the only path whose cost was higher than the average cost. The least volume is added to path 2 because the costs of path 2 were closest below the average cost. The most volume is added to path 1, because path 1 was the least expensive path.
Redistribution path 1 to 4:
Result and comparison of the relative target volume before and after
If the last completed simulation run was the fourth simulation run of this assignment, as in the example, a quarter of the total volume must be redistributed for the OD pair according to the redistribution algorithm. The new target volumes are determined by adding a quarter of the values from the Redistribution illustration above to the values from the first illustration above Relative target volume of previous simulation runs. The following illustration shows the new relative target volumes. The relative target volume of path 3 has dropped considerably, while the target volume of path 1 has increased significantly. Path 4 now also has volumes. The relative target volume of path 2, by contrast, is nearly unchanged.
Comparison relative target volume path 1 to 4 before and after:
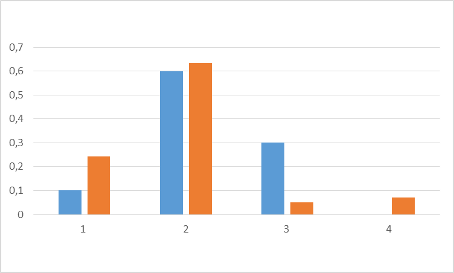
: Relative target volume before, left bar
 : Relative target volume after, right bar
Superordinate topic:
