Examples of visualization of pedestrian parameters
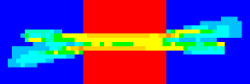
Typical area-based visualization of essential parameters - examples
Example 1: Parameter Speed, with default settings:
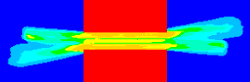
Example 2: Parameter Density, with default settings:
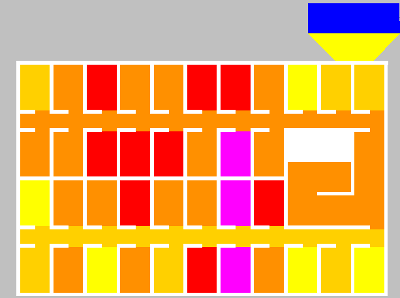
Typical grid-based visualization of essential parameters - examples
The parameters are depicted with the help of the simulation in the example file ..\Examples Training\Pedestrians\Counterflow\Counterflow-2Rooms - Simple.inpx.
The image above is the result of the following configuration:
| Parameter | Value |
|---|---|
|
Scheme |
LOS: User-defined: Density |
|
Cell size |
1.0 m |
|
Range of influence |
1 |
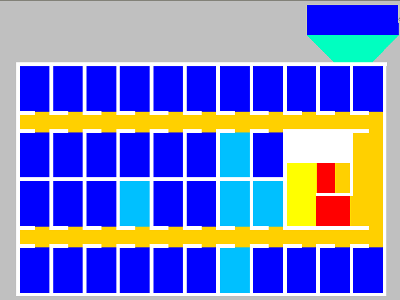
The image below is the result of the following configuration:
|
Parameter |
Value |
|---|---|
|
Scheme |
LOS: User-defined: Density |
|
Cell size |
0.2 m |
|
Range of influence |
5 |
Superordinate topic:
Assigning a color to areas based on aggregated parameters (LOS)
Information on editing:
Editing graphic parameters for network objects
Editing base graphic parameters for a network editor
Assigning a color to nodes based on an attribute
Dynamically assigning a color to vehicles during the simulation
Assigning a color to vehicles based on an attribute
Assigning a color to pedestrians based on an attribute
Assigning a color to links based on aggregated parameters
Assigning a color to areas based on aggregated parameters (LOS)
Using LOS schemes for showing aggregated pedestrian values
Assigning a color to ramps and stairs based on aggregated parameters (LOS)
Assigning a color to parking spaces, parking lots or parking lot gorups based on an attribute
