Defining the Wiedemann 74 model parameters
This model is an improved version of Wiedemann’s 1974 car following model.
The following parameters are available:
| Parameters | Description |
|---|---|
| Average standstill distance (w74ax) |
(ax): Base value for average desired distance between two stationary cars. The tolerance lies within a range of –1.0 m to +1.0 m which is normally distributed at around 0.0 m, with a standard deviation of 0.3 m. This leads to "stochastic smearing" of ax. Default 2.0 m. |
| Additive part of safety distance (w74bxAdd) |
bxadd: Value used for the computation of the desired safety distance d. Allows to adjust the time requirement values. Default 2.0 m. |
| Multiplicative part of safety distance (w74bxMult) |
bxmult): Value used for the computation of the desired safety distance d. Allows to adjust the time requirement values. Greater value = greater distribution (standard deviation) of safety distance Default 3.0 m |
The desired distance d is calculated from:

where:
ax: "stochastically smeared" base value for standstill distance, see table above.

v: Vehicle speed [m/s], minimum value 0.1. As a result, the actual standstill distance is about 0.316 m greater than the additional "stochastically smeared" ax.
z: is a value of range [0.1], which is normally distributed around 0.5 with a standard deviation of 0.15
Defining the saturation flow rate with the Wiedemann 74 modeling parameters
The saturation flow rate defines the number of vehicles that can flow freely on a link for an hour. Impacts created through signal controls or queues are not accounted for. The saturation flow rate also depends on additional parameters, e.g. speed, share of HGV, or number of lanes.
You define the saturation flow by combining the parameters Additive part of safety distance and Multiplicative part of safety distance. Experienced users may want to use these parameters to adapt their model to observation data.
|
|
Note: The graphs show the saturation flow rates calculated for examples used in Vissim. When using a different network, you receive graphs depicting different values. |

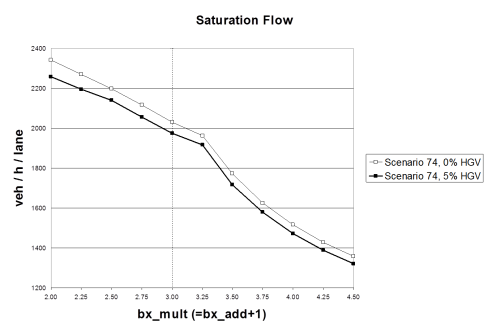
For the example, Scenario 74 was created with the following parameters:
- single lane link
- speed distribution between 48 km/h and 58 km/h
- Default driving behavior, with the exception of parameters bxadd (Additive part of safety distance) and bxmult (Multiplicative part of safety distance) that vary along the x-axis. In this example the following applies: bxadd = bxmult-1
- one time step per simulation second
Superordinate topic:
