Defining desired speed distributions
You can define new desired speed distributions and add intermediate points as spline points to the course of the curve. In general, two nodes are sufficient to achieve more or less an S-shaped distribution, and thus a concentration around the mean value.
1. On the Base Data menu, click > Distributions > Desired Speed.
The Desired Speed Distributions list opens.
2. In the list, on the toolbar, click the Add button  .
.
A new row with default data is inserted.
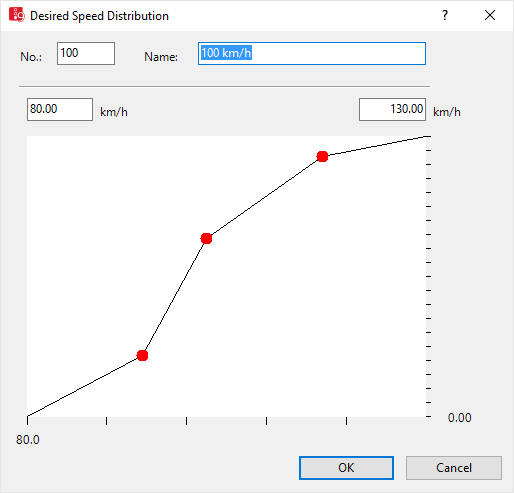
The Desired Speed Distribution window opens.
3. Make the desired changes:
| Element | Description |
|---|---|
| Name | Description |
| Left field with speed unit | Minimum desired speed |
| Right field with speed unit | Maximum desired speed |
4. Right-click in the line.
A node is entered.
5. Click the intermediate point and keep the mouse button pressed.
6. With the mouse button pressed, drag the intermediate point to the desired position.
7. Release the mouse button.
The horizontal axis depicts the desired speed. The vertical axis depicts the proportional value in the value range from 0.0-1.0. The course of the curve is adjusted. The labeling for the y and x axes is adjusted. The figure shows an example in which 22 % of the vehicles drive between 80.0 and 94.50 km/h and 78% of the vehicles between 94.50 km/h and 130.00 km/h (all equally distributed across the speed range). Due to the S-shaped distribution of the three intermediate points at 94.50 km/h, approx. 104 km/h and 116 km/h, a concentration around the mean value 105 km/h is achieved.
8. Confirm with OK.
The desired speed distribution is displayed in the Desired Speed Distributions list (Attributes of desired speed distributions).
Superordinate topic: