Defining the Wiedemann 99 model parameters
This model is based on Wiedemann’s 1999 car following model.
The following parameters are available:
| Parameters | Unit | Description |
|---|---|---|
|
CC0 |
m |
Standstill distance: The desired standstill distance between two vehicles. It has no variation. You can define the behavior upstream of static obstacles via the attribute Standstill distance for static obstacles (Editing the driving behavior parameter Following behavior). |
|
CC1 |
s |
Following distance: Time distribution of speed-dependent part of desired safety distance. Shows number and name of time distribution Each time distribution may be empirical or normal. Each vehicle has an individual, random safety variable. Vissim uses this random variable as a fractile for the selected time distribution CC1. Based on the time distribution, the following distance for a vehicle is calculated. This is the distance in seconds which a driver wants to maintain at a certain speed. The higher the value, the more cautious the driver is. The safety distance is defined in the car following model as the minimum distance a driver will maintain while following another vehicle. In case of high volumes this distance becomes the value which has a determining influence on capacity. |
|
CC2 |
m |
Longitudinal oscillation: Restricts the distance difference a driver allows for before he intentionally moves closer to the car preceding him. If this value is set to e.g. 10 m, the following behavior results in distances between dxsafe and dxsafe + 10m. The default value is 4.0m which results in a quite stable following behavior. |
|
CC3 |
s |
Perception threshold for following: Defines the beginning of the deceleration process, i.e. the number of seconds before the safety distance is reached. At this stage the driver recognizes a preceding slower vehicle. |
|
CC4 |
m/s |
Neg. speed difference: Defines negative speed difference during the following process. Low values result in a more sensitive driver reaction to the acceleration or deceleration of the preceding vehicle. |
|
CC5 |
m/s |
Pos. speed difference: Defines positive speed difference during the following process. Enter a positive value for CC5 which corresponds to the negative value of CC4. Low values result in a more sensitive driver reaction to the acceleration or deceleration of the preceding vehicle. |
|
CC6 |
1/(m • s) |
Influence speed on oscillation: Influence of distance on speed oscillation during the following process:
|
|
CC7 |
m/s2 |
Oscillation acceleration: Minimum value for absolute acceleration/deceleration used by a driver when following another vehicle. |
|
CC8 |
m/s2 |
Acceleration starting from standstill: Desired acceleration when starting from standstill (limited by maximum acceleration defined within acceleration curves). |
|
CC9 |
m/s2 |
Acceleration at 80 km/h: Desired acceleration at 80 km/h (limited by maximum acceleration defined within acceleration curves). |
|
|
Note: The units of Wiedemann 99 model parameters cannot be edited. These units are independent of the network settings for units in the base data. |

Defining the saturation flow rate with the Wiedemann 99 modeling parameters
The saturation flow rate defines the number of vehicles that can flow freely on a link for an hour. Impacts created through signal controls or queues are not accounted for. The saturation flow rate also depends on additional parameters, e.g. speed, share of HGV, or number of lanes.
In the car-following model Wiedemann 99, parameter CC1 has a major impact on the safety distance and saturation flow rate. The scenarios shown below as an example are based on the following assumptions:
- car-following model Wiedemann 99, containing default parameters with the exception of CC1 that varies across the x-axis
- one time step per simulation second
The main properties of the following graphs are:
|
Scenario |
Right-side rule |
Lane |
Speed cars* |
Speed HGV* |
% HGV |
|---|---|---|---|---|---|
|
99-1 |
no |
2 |
80 |
n/a |
0% |
|
99-2 |
no |
2 |
80 |
85 |
15% |
|
99-3 |
yes |
2 |
80 |
n/a |
0% |
|
99-4 |
yes |
2 |
80 |
85 |
15% |
|
99-5 |
yes |
2** |
120 |
n/a |
0% |
|
99-6 |
yes |
2 |
120 |
85 |
15% |
* Vissim default setting
** Lane 2 closed for HGV traffic
|
|
Note: The graphs show exemplary calculated saturation flow rates. When using a different network, you receive graphs depicting different values. |
Example: Graphs of saturation flow rate Scenario 99-1 to 99-6
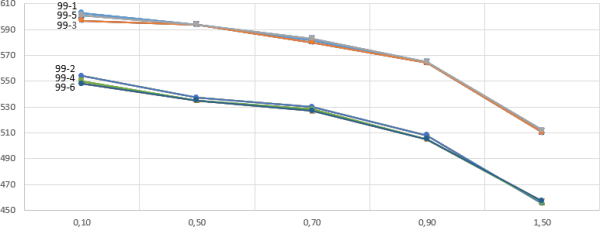
Horizontal x-axis: Variation CC1: 0.1 to 1.5
Vertical y-axis: Veh/h/lane
Superordinate topic: