You can visualize turn values in 2D mode. Turn values represent the values of result attributes or user-defined attributes along the turn relations in a node. In the Network editor, you can visually compare turn values that arise in one or multiple nodes.
In the graphic parameters of the network object type Node, when you configure the display settings for turn values, you select two attributes (Configuring turn value visualization):
In addition to numeric attribute values, you can show total values (Configuring turn value visualization). Circular segmental arches separate the total values from the numeric attribute values.
To visualize turn values in the Network editor, in the graphic parameters of the network object typeNode, select Turn value visualization.
The node attribute Object visibility also controls the visibility of turn values.
In addition, you can activate turn value visualization for each node of your choice (Activate turn value visualization). This allows you to compare turn values that arise in one or multiple nodes during or after a simulation run. During the simulation run, turn values are visualized based on the interval set for the evaluation of the node.
To perform a Node evaluation, first select the attribute Collect dataa (Evaluating nodes). For each node whose turn values you want to visualize, select the Use for evaluation attribute.
The node-edge graph must be created for node evaluation (Generating a node-edge graph).
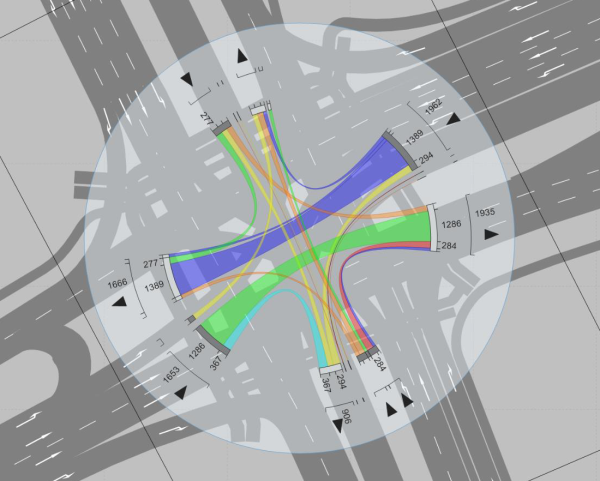
Elements from outwards tow inwards:
|
Light blue circle with blue outline |
Defines the range of the turn value visualization. You can enlarge or reduce this area (Editing the size of turn value visualization for a node). |
| Arrow tip |
Shows the direction of travel. |
| Value next to the arrow tip | If the light blue circle is sufficiently large: Sum of the attribute values of turn value bands for each input and output |
| Circle segment arc |
Separates arrow tips and sums from attribute values. |
| Circle segment |
|
| Value between circle segment and turn value band |
If the light blue circle is sufficiently large: numeric attribute value at the beginning and end of each turn value band. |
|
Turn value band |
Each turn relation in the node, from entry to exit, is represented by a turn value band. The width at the beginning and end and the color are based on the configuration of turn value visualization and the values of the selected attributes (Configuring turn value visualization). In order to avoid overlapping turn value bands during visualization, their width is reduced in the middle. The width of that part of the band is not used to visualize any values. Width and color of the turn values displayed already change during simulation, as they are based on values determined using the interval set for node evaluation. |
The graphic shows a turn value visualization with the following settings: