Open topic with navigation
Saving pedestrian travel time measurements from OD data to a file
If you manage the pedestrian demand of the OD relations between the pedestrian areas as a pedestrian origin-destination matrix, you do not need to define pedestrian inputs or pedestrian routing decisions with pedestrian routes to destination areas (Pedestrian OD matrices). From a simulation based on a pedestrian origin-destination matrix, you can save the following aggregated data to an *.rsmp file:
- Travel time
- Delay
- Relative delay
- Volume
|

|
Note: You do not need to define any travel time measurements. Vissim defines travel time measurements automatically at the start of the simulation. A temporary travel time measurement is generated for each OD relation in the pedestrian origin-destination matrix:
- The temporary travel time measurement starts at the start area.
- The temporary travel time measurement ends at the destination area.
The output data results from the pedestrian volume per OD relation and aggregation interval.
Further routes of a pedestrian in the network are ignored.
|
Relevant pedestrians for the evaluation
- Pedestrians who are generated in the origin area according to the pedestrian input are taken into account.
- Pedestrians who reach the destination area at the end of their current static route (which began at one of the origin areas) are taken into account.
- Pedestrians who enter an origin area when they leave a PT vehicle are not taken into account.
- Pedestrians who get to the origin area from another area are not taken into account.
This also includes pedestrians who traveled a partial route between origin and destination, and pedestrians who are located in the current destination area, but are continuing their walk according to a further routing decision, i.e. these pedestrians are also taken into account.
- The arrival time of a pedestrian at the destination area must be in the evaluation period. Thus only the end of the evaluation period belongs to the interval, and not the start of the evaluation period.
- The start time of the pedestrian in the origin area is not relevant.
- Pedestrians who use different static routes for their path from the same origin area to the same destination area are not differentiated. The following thus applies:
- For each OD relation, the output data results from all relevant pedestrians.
- There may be multiple static routes for an OD relation.
- A pedestrian who has completed his route from the origin area to the destination area is no longer recorded.
Examples:
- The pedestrian is no longer relevant if, in the course of his other routes, he once again takes his original static route from the original origin area to the same destination area.
- The pedestrian is also no longer relevant if his next destination area could also be reached from his original origin area via another static route.
- A pedestrian who enters an area on his static route to his destination, which is the destination area of another static route and which also starts at the routing decision of the pedestrian in his origin area, is also not recorded. This pedestrian is only included in the evaluation when he has reached the destination area of his static route.
- Pedestrians with circular routes, which start in area X and also end in this area X, are included in the evaluation. Since pedestrians within an area are not considered, a circular route requires at least one route intermediate point in an area outside area X, which is the origin and destination of the static route. Even area X, which is the origin and destination of a circular route, can be an intermediate point of the circular route if another intermediate point then exists in another area in the circular route before the route destination is reached in area X.
Configuring direct output of the pedestrian travel times (OD data)
1. From the Evaluation menu, choose > Configuration > Direct Output tab.
2. In the Pedestrian travel time (OD data) row, select the option Write to file.
3. You can change the time if you wish (Using the Direct output function to save evaluation results to files).
4. Click the More button.
The Pedestrian travel time (OD data) window opens.
5. If desired, change the aggregation interval.
6. Confirm with OK.
7. Start the simulation (Running a simulation).
The *.rsmp file is saved. If the simulation ends before the specified end of the evaluation, the evaluation also ends with the simulation. Thus the last time interval may be incomplete. The corresponding result values for the remaining time interval are still saved.
Results of the evaluation of pedestrian travel times (OD data)
The output file *.rsmp contains the following data:
|
File title
|
Name of evaluation
|
|
File
|
Path and name of network file
|
|
Comment
|
Comment on simulation
|
|
Date
|
Time of evaluation
|
|
PTV Vissim
|
Version number, service pack number, build number
|
|
Data
|
Data blocks with the attributes for each OD relation:
- for the entire evaluation period
- separately for each evaluation interval
Header data (one row):
- Parameter
- Valid time interval in simulation seconds
- List of destination areas
Output data:
- One row per origin area with the output values per attribute and OD relation
- For each time interval: separate data block with measurement data per OD relation
|
Each data block contains the following evaluation data:
|
Travel time
|
Average of all travel times of relevant pedestrians per OD relation.
|
|
Delay
|
Average of all total delay values per OD relation.
For each pedestrian, the delay in each simulation step results from:

Example:
The delay is 25% of the length of the time step for a pedestrian at 75% of his desired speed.
These values are added up over the entire measured distance of the pedestrian.
|
|
Note: Negative values reduce the total delay value.
|
|
|
Relative delay
|
Average of all relative delays per OD relation
This value is determined separately for each pedestrian as a percentage of the delay in the travel time.
|
|
Volume
|
Number of pedestrians on the basis of which the other result attributes were determined.
|
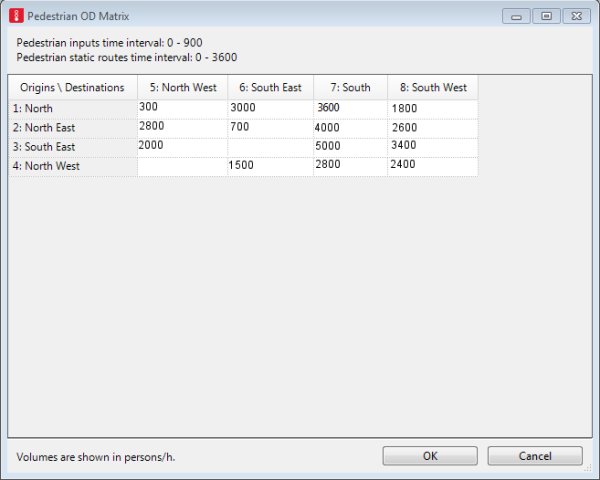
Example: Output file *.rsmp
An output file is saved for the following matrix:
In the example, line breaks in the data block (0s-360s) facilitate readability:
Pedestrian travel time measurement (OD data)
File    C:\Users\Public\Documents\PTV Vision\PTV Vissim 11\Examples Training\Pedestrian OD Matrix.inpx
Comment:
Date: Monday, 19 January 2019 12:23:33
PTV Vissim 11.00-00* [77950]
Travel time:0s-360s;3;4;5;6;
Delay:0s-360s;3;4;5;6;
Relative delay:0s-360s;3;4;5;6;
Volume:0s-360s;3;4;5;6
1;0.0;0.0;53.5;61.0;
1;0.0;0.0;4.5;4.4;
1;0.00;0.00;0.09;0.07;
1;0;0;166;85
2;31.7;0.0;0.0;73.4;
2;4.1;0.0;0.0;6.0;
2;0.13;0.00;0.00;0.08;
2;97;0;0;97
4;33.2;0.0;0.0;0.0;
4;5.3;0.0;0.0;0.0;
4;0.17;0.00;0.00;0.00;
4;87;0;0;0
8;0.0;77.3;0.0;0.0;
8;0.0;7.4;0.0;0.0;
8;0.00;0.10;0.00;0.00;
8;0;108;0;0

Travel time:0s-180s;3;4;5;6;Delay:0s-180s;3;4;5;6;Relative delay:0s-180s;3;4;5;6;Volume:0s-180s;3;4;5;6
1;0.0;0.0;51.7;58.0;1;0.0;0.0;4.2;4.0;1;0.00;0.00;0.08;0.07;1;0;0;106;53
2;31.5;0.0;0.0;0.0;2;4.0;0.0;0.0;0.0;2;0.13;0.00;0.00;0.00;2;80;0;0;0
4;33.1;0.0;0.0;0.0;4;5.6;0.0;0.0;0.0;4;0.17;0.00;0.00;0.00;4;74;0;0;0
8;0.0;0.0;0.0;0.0;8;0.0;0.0;0.0;0.0;8;0.00;0.00;0.00;0.00;8;0;0;0;0

Travel time:180s-360s;3;4;5;6;Delay:180s-360s;3;4;5;6;Relative delay:180s-360s;3;4;5;6;Volume:180s-360s;3;4;5;6
1;0.0;0.0;56.6;66.0;1;0.0;0.0;5.0;4.9;1;0.00;0.00;0.09;0.07;1;0;0;60;32
2;32.5;0.0;0.0;73.4;2;4.8;0.0;0.0;6.0;2;0.15;0.00;0.00;0.08;2;17;0;0;97
4;33.7;0.0;0.0;0.0;4;3.9;0.0;0.0;0.0;4;0.12;0.00;0.00;0.00;4;13;0;0;0
8;0.0;77.3;0.0;0.0;8;0.0;7.4;0.0;0.0;8;0.00;0.10;0.00;0.00;8;0;108;0;0