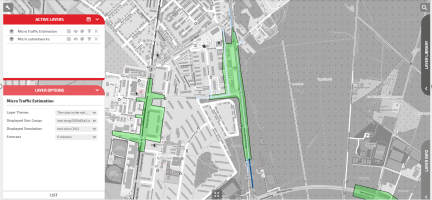
The Micro Traffic Estimation layer displays several types of data associated with the Optima Micro subnetworks.
The traffic estimation data can be filtered using the following parameters:
- Simulation group
- Simulation (according with the selected simulation group)
- Forecast (according with the selected simulation)
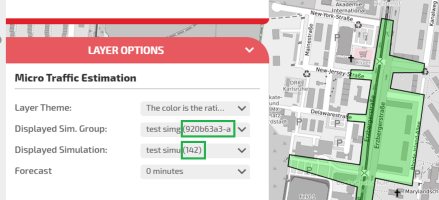
In the image you can see an example of the layer filtered using:
- Simulation group > test simg
- Simulation > test simu
- Forecast > 0 minutes
Near the filter selected, the identificator (green rectangle) of the simulation group (of the simulation) is shown.
| Info type | Description |
|---|---|
|
|
Traffic is very low. |
|
|
Traffic is low and smooth. |
|
|
Traffic is medium and almost smooth. |
|
|
Traffic is high and slowing down. |
|
|
Traffic is highly saturated, temporary queues expected. |
|
|
Traffic is over saturated, continuous queue build-up expected |
| Option type | Description |
|---|---|
|
Theme |
Allows you to choose a set of graphic themes to represent the layer entities. |
|
Displayed Simulation Group |
Allows you to choose the simulation group. |
|
Displayed Simulation |
Allows you to choose the simulation contained in the simulation group selected in the previous filter. |
|
Forecast |
Allows you to choose a specific forecast interval time associated with the simulation. The selectable values are:
|
- Select the layer in the ACTIVE LAYERS list.
- Click the
 List icon.
A pop-up window with a list of items opens. Every item represents a street (or link) characterized by a set of attributes.
Other operations are available for the layer (→ Operations on layers).


