Harmonizer workflow
The graphic illustrates how Harmonizer processes and fuses data:
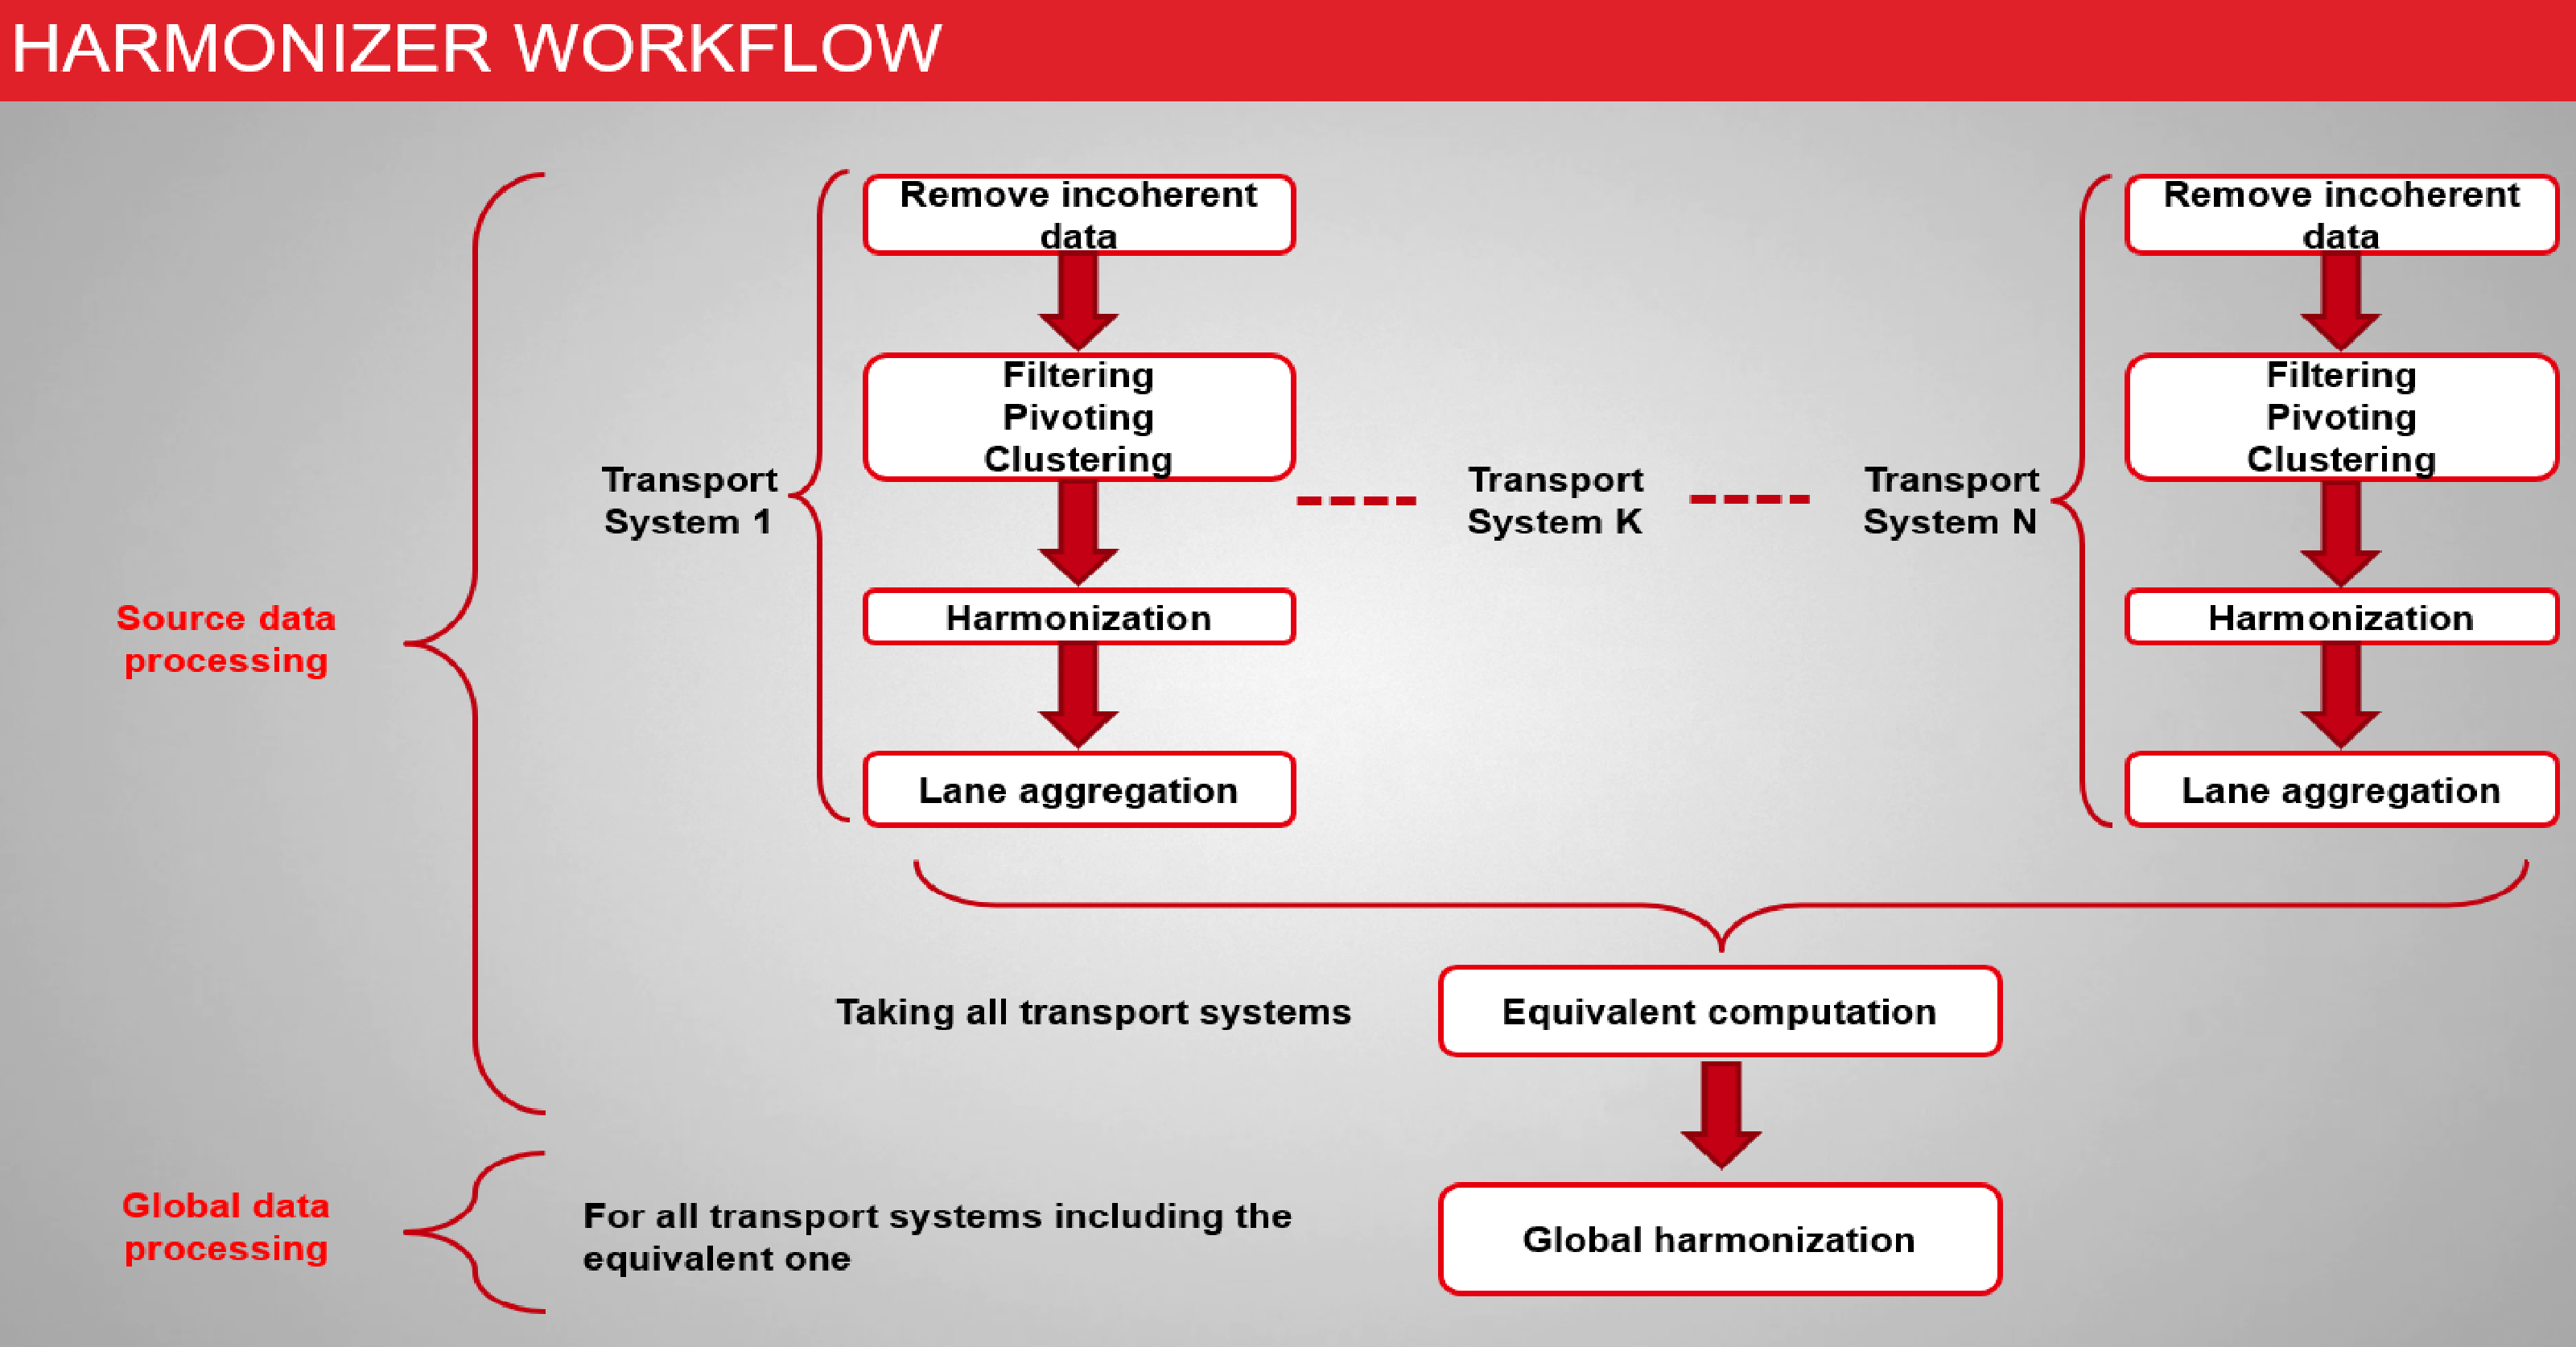
The process can be divided in two sequential macro phases:
-
Source data processing: This is the first phase, in which data is processed for each single source.
- Global data processing: This is the second phase, in which all sources are fused together.
Source data processing
After data collection, the listed steps are executed for each source:
-
Removing incoherent data: Data is considered incoherent if both listed conditions are verified:
- At least one record refers to a count location for which the CLOC.AGGREGATE_LANES=TRUE (see → Real-time traffic data).
- Another record refers to another count location on the same street, with the same attribute set to false.
In this case, all data referencing that street are discarded. Hence, please be sure that if you have more than one CLOC on a street, they must be set in the same way.
-
Filtering: The collected data is filtered to reflect its reliability for the configured set of rules.
-
Pivoting: The datasets are used to accumulate historical quantities of averaged data and to pivot the actual incoming data with respect to reference values of speed and flow.
-
Clustering: The rejection of any unreasonable input is controlled by accepting only data whose values fall within a range clustered around the most meaningful measurements.
-
Harmonization: This step averages all data of the given source and transport system. It implies that the source weight must be set to one during the computation, and the computed accuracy is the result of the average of the reliabilities that concur with the harmonized data. That accuracy will be treated as a reliability in the subsequent steps of the overall process. Moreover, if data should later be aggregated by lane, after this step, the harmonized data must preserve this information.
-
Equivalent computation: This step can optionally be carried out for each data source. As input, for a given street and lane, it uses all traffic states of the given transport systems and computes an aggregated traffic state on the same street and lane suitably weighting the input information.
Global data processing
This phase starts after all data has been processed for all sources.
For each transport system, including the equivalent ones if they exist, a new harmonization step is performed.
Please note that at the end of the source data processing phase, each tuple defined by a (street, lane, transport system, source) has one traffic state at most. Hence, the harmonization step performed in this phase processes and averages data from different sources. The results are collected in the database.
 Data collection and removing incoherent data
A single measurement is a set of two numerical values: flow and speed. The set of these three values represents a single traffic state measurement through a sensor within a specific time interval.
At regular time intervals, data from the different configured sources is collected in the database tables, organized by street and transport system indexes. This is typically done by loading data from trafficstate tables.
As a first step, the measurements are validated and those measurements that can be safely considered incoherent are discarded. For example, measurements with negative values or zero flows with non-zero speed values.
Next, a reliability parameter and a weight based on the specific datasource are assigned to each measurement.
Filtering on measurements
The filtering step is applied for each source and each transport system on each directional street separately.
The Harmonizer filters the different traffic data collected according to a defined set of rules and sets its reliability values.
The filtering rules to be applied are defined in an XML configuration file (see → Harmonizer configuration).
Pivoting
The pivoting procedure performs two major tasks:
-
A time series of data xn is accumulated over the index n and its average An is computed iteratively as
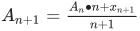
(A0 = 0)
With the m-th order, the momentum Mm is computed as:

(m > 0)
-
The actual incoming data is normalized with respect to reference values max, provided by the database table STRT, defining a pivoted value as

where the maximum MAX is defined as a function of the average and of the m-th momentum defined above:

The order m of the momentum to be used, as well as the maximum number of elements to take into account for the computation of the pivoted average, are set in the <pivoting> node of the configuration file (see → Harmonizer configuration).
If the pivoting is scheduled, the output is written to the database table PIVOT.
Important: The pivoting phase can be disabled by configuration.
Clustering
Clustering is performed for each source and each associated transport system, on each directional street and lane separately.
In this step, the only data that is taken into account is within a plausible interval.
The common interval is defined as I = [x, x+W], where the width of the validity range W is defined in the <clustering> node (for every specific parameter) of the configuration file (see → Harmonizer configuration).
For each set of measurements, for each source and street, the algorithm selects, among the intervals I = [x, x+W] defined around each measurement x, the range that maximizes the sum of the reliabilities pm (objective function) corresponding to each measurement value xm falling in the same interval. If multiple sets have the same maximum value for the sum of the reliabilities, the software uses only the last set that has been evaluated for its further computations.
The set of measurements corresponding to the optimal interval is M.
Being W known and constant, the optimal interval is a function of its lower extreme x.
In case there is more than one value maximizing the objective function, the higher one of them is usually taken.
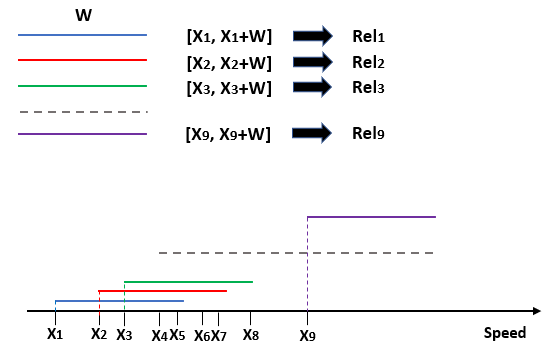
Example: interval I = [x, x+W] in one dimension
In this example, a graphical view of the evolution of the measurements interval is used to calculate the associated reliabilities for the values of speed.
The optimal interval is the interval with the higher value of reliability:
(Relx=sum(pm)).
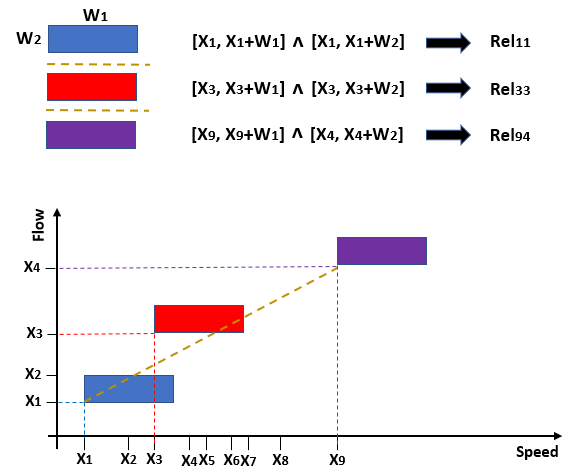
Example: interval I = [x, x+W] in two dimensions
As in the previous example, there are two dimensions, with two different values (W1 and W2) for interval width related to flow and speed.
Data harmonization
This is the procedure used to evaluate an average over the entire set of data:
- For each street, the harmonized measurement is the weighted mean of clustered measurements of all sources (the actual weight is the product of the reliability and weight of the source).
- If m is a single value of the measurement (flow, speed), pm the related reliability, and pf the weight of the source, the harmonized value X is

-
The accuracy (attribute accu in the TDE table) associated with this value X is
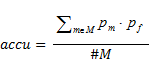
where the denominator is the number of measurements falling into the optimal clustered interval defined above.
Lane aggregation
The use of the aggregated results for KPI computation may lead to bad results if not all the lanes are monitored
Note: A speed measure no lanes will be also used in the simulation. in this case the aggregated result may be particularly hard to be interpreted.
The lane aggregation property can be configured "by model", therefore according to information collected in the network model.
If the property is set for a specific source, after this step, only data referencing the whole street is available and no lane-based information is stored as output.
The property is set if CLOC.AGGREGATE_LANES=TRUE.
If there is already some input data that refers to the whole street, then the aggregation process should overwrite the input data.
On the other hand, if the only available input is per street (no lane info), then the original data should be preserved regardless of the value of the aggregate attribute.
This aggregation step computes:
-
Flow: as the sum of not null flows of each lane (flows equal to zero are aggregated).
-
Speed: as the average speed of not null speeds of each lane (speeds equal to zero are averaged).
-
Reliability: as the average of reliabilities.
In this step, the averages are simple arithmetic data.
All previous steps are performed for each transport system.
According to the specific configuration of each source, an extra step can be carried out to produce equivalent measurements.
Important: If CLOC.AGGREGATE_LANES=FALSE and one or more lanes are not monitored, KPI computation results may not be reliable.
Equivalent computation
-
Flow: as the weighted sum of not NULL flows, where the weight is provided by the transport system scaling factor (see EQVE field of the "Transport systems – TSYS table" on page 1).
Therefore, by indicating with
 the flow of the transport system i , and with
  its EQVE value, the resulting flow will be:
-
Speed: as the weighted average of not NULL speeds, where the weight is the not NULL flow of the corresponding transport system. Speeds without flow information will be discarded.
Therefore, by indicating with
 the flow of the transport system i, and with
  the speed of the same transport system, the resulting speed will be:
 - Reliability: as the average of the reliabilities.
|
|

Note that if all traffic states have NULL flow, the computed speed will be a simple arithmetic average.
Output of Harmonizer
The values X and accu , calculated for each street of the network and transport system, are the actual outputs of Harmonizer.
They can be:
- Stored into database tables as defined by the destinations; the default table is TSTA (→ Architecture and Data Model).
- Configured to be stored in the memory of another module; in this case, you can avoid storing the output in the DB.
In the first case, you can also configure an SQL statement to run before (pre-action) or after (post-action) storing data in the DB.