The Traffic Realtime Equilibrium algorithm aims to converge iteratively to the user choices (demand), that are optimal with respect to the network costs arising from the interaction between said choices (supply).

In presence of a signal pulse dynamic, the general relation between Travel TIme and Simulation Interval can be drawn as shown in the diagram:

According to the red signal, the travel time is rapidly growing.
TRE works on two different temporal discretizations:
- Simulation Interval, usually about 10 seconds.
- Results Interval, usually about 100-1000 seconds.
Therefore, in a single result interval we find 10 to 100 simulation intervals.
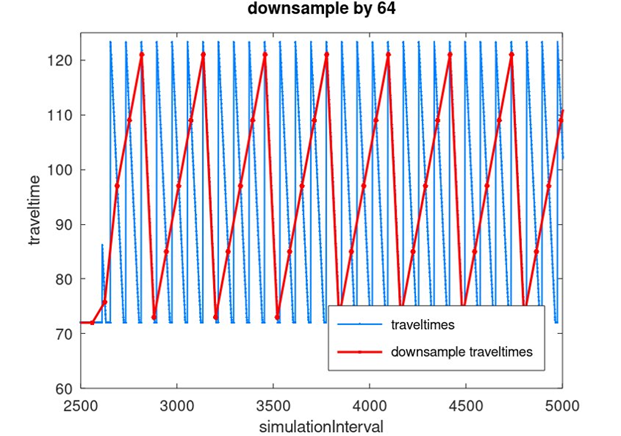
Sampling the value of the measurement in the results range (in the diagram, red dots values), you risk to get results completely different from the nature of the input signal (travel time in the simulation interval).
In the Theory of Signals, this is a well known phenomena, called Aliasing.
Extreme aliasing problems can generate an inconsistent sampling value (at a certain instant) of the travel time, which however is considered valid for the entire assignment interval.
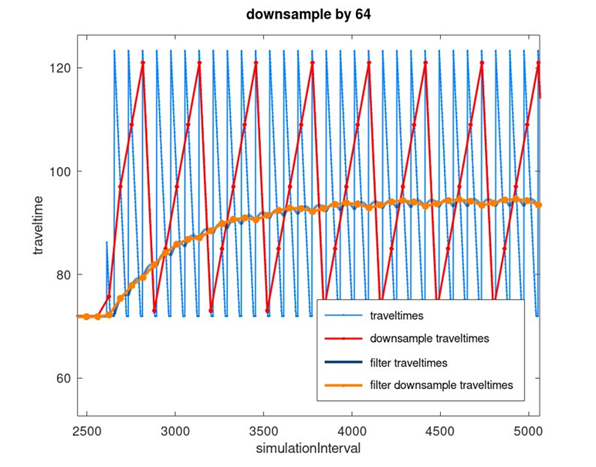
The solution is to filter the signal before the sampling, therefore to apply the filter to the travel time diagram.
A Butterworth filter is implemented and integrated into the TRE algorithm (automatically set if SignalPulse=1 (→ SignalPulse)), to smooth the travel time «signal» before feeding it to the route choice model.
Important: The filter behaviour is validated against the underlying theory and publicly available scientific libraries through GNU Octave.
The Butterworth filter produce a diagram like the dark blue line in the diagram:

In the next diagram, it's clearly visible the effect of the Buttleworth filter (anti-aliasing filter).
The orange curve is based on sampling the filtered travel times.
The results sampled curve is largely overlapped with the curve of the filtered travel times.
The effect of the Butterworth filter on travel times also has an impact on the stability of the flows measurement, as shown in the diagram.

TEST FOR LINKED PROJECT